ELK
- ELK 不是一款软件,而是 Elasticsearch、Logstash 和 Kibana 三种软件产品的首字母缩写
- Elasticsearch:分布式搜索和分析引擎,具有高可伸缩、高可靠和易管理等特点
- Logstash:数据收集引擎,它支持动态的从各种数据源搜集数据并处理数据
- Kibana:数据分析,可视化平台
Filebeat
- Filebeat 是一个轻量型的服务对服务器压力比较小,用于采集数据,并上报到Logstash或Elasticsearch
Beats
- Packetbeat => 搜集网络流量数据
- Topbeat => 搜集系统、进程和文件系统级别的 CPU 和内存使用情况等数据
- Filebeat => 搜集文件数据
- Winlogbeat => 搜集 Windows 事件日志数据
- Metricbeat => Ship and analyze metrics.
- Heartbeat => Ping your Infrastructure.
- Auditbeat => Send audit data to Elasticsearch.
- Functionbeat => Ship cloud data with serverless infrastructure.
- Journalbeat => Analyze Journald logs.
架构
 Filebeat ->
             ->
 Filebeat -> -> -> -> Logstash -> Elasticsearch -> Kibana
             ->
 Filebeat ->
安装
-
elasticsearch 下载 地址
- 启动命令
  linux    bin/elasticsearch
  Windows  bin\elasticsearch.bat
- elasticsearch 默认服务地址 http://localhost:9200/
//访问 http://localhost:9200/ 正确返回数据
{
"name": "linux-pc",
"cluster_name": "elasticsearch",
"cluster_uuid": "_Jb2j7Z0RO2EK5Nsr1GqjQ",
"version": {
  "number": "7.6.1",
  "build_flavor": "default",
  "build_type": "tar",
  "build_hash": "aa751e09be0a5072e8570670309b1f12348f023b",
  "build_date": "2020-02-29T00:15:25.529771Z",
  "build_snapshot": false,
  "lucene_version": "8.4.0",
  "minimum_wire_compatibility_version": "6.8.0",
  "minimum_index_compatibility_version": "6.0.0-beta1"
},
"tagline": "You Know, for Search"
}
-
kibana 下载 地址
-
kibana 默认服务地址 http://localhost:5601
-
启动命令
-
//打开 config/kibana.yml文件 //在elasticsearch.hosts中写上elasticsearch的地址 //elasticsearch.hosts: [“http://localhost:9200”] linux bin/kibana Windows bin\kibana.bat
- logstash 下载 [地址](https://www.elastic.co/cn/downloads/logstash)

+ logstash.conf  [配置文件最佳实践](http://docs.flycloud.me/docs/ELKStack/logstash/index.html)
+ 启动命令

```base'''''
bin/logstash -f logstash.conf
./filebeat -e -c filebeat.yml
## 监控 git-kit 服务

+ filebeat.yml 配置

```base
filebeat.inputs:
- type: log
enabled: true
paths:
  - /home/go/src/learning_tools/logs/go-kit-v11-client-*.log
document_type: "kit-client"   #指定类型  在elastic中可通过[type]识别
fields:
  tag: kit-client                #指定标签  在logstahs中可通过[fields][tag]识别
- type: log
enabled: true
paths:
  - /home/go/src/learning_tools/logs/go-kit-v11-server-*.log
document_type: "kit-server"
fields:
  tag: kit-server

# 积累1024条消息才上报
#spool_size: 1024
# 或者空闲5s上报
#idle_timeout: "5s"

output.logstash:
hosts: ["0.0.0.0:5044"]

//output.elasticsearch:
//  # Array of hosts to connect to.
//  hosts: ["0.0.0.0:9200"]
//  # Optional protocol and basic auth credentials.
//#protocol: "https"
//#username: "elastic"
//#password: "changeme"
- logstash.conf 配置 这里只做最基础演示,其他高级功能 点击
input  #Input Plugin处理数据输入
{
  beats
  {
    port => 5044
  }
}
output  #Output Plugin将格式化数据输出到指定目标文件
{
  stdout { #控制台输出日志
    codec => rubydebug
  }
 if [fields][tag] == "kit-server"
   {
    elasticsearch {
      hosts => ["http://localhost:9200"]
      index => "kit-server-%{+YYYY.MM.dd}"
    }
  }

if [fields][tag] == "kit-client"
   {
    elasticsearch {
      hosts => ["http://localhost:9200"]
      index => "kit-client-%{+YYYY.MM.dd}"
    }
  }

}
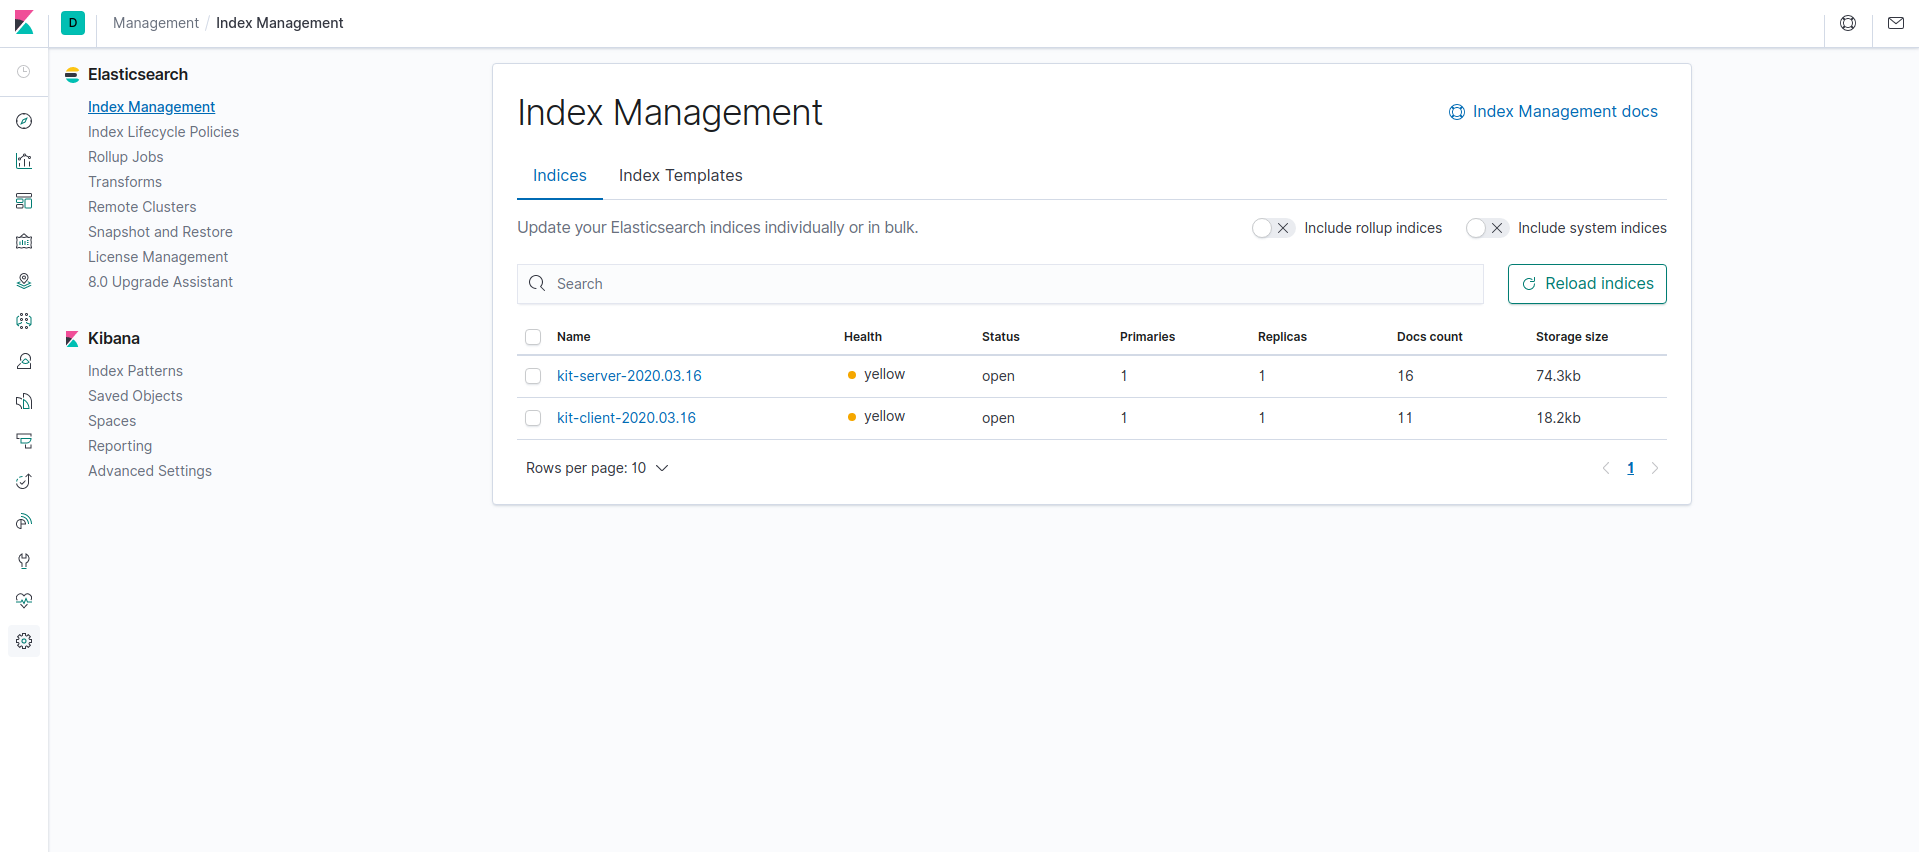
访问 http://localhost:5601 我们就可以通过 kibana 查看日志了
-
查看我们建立的文件

-
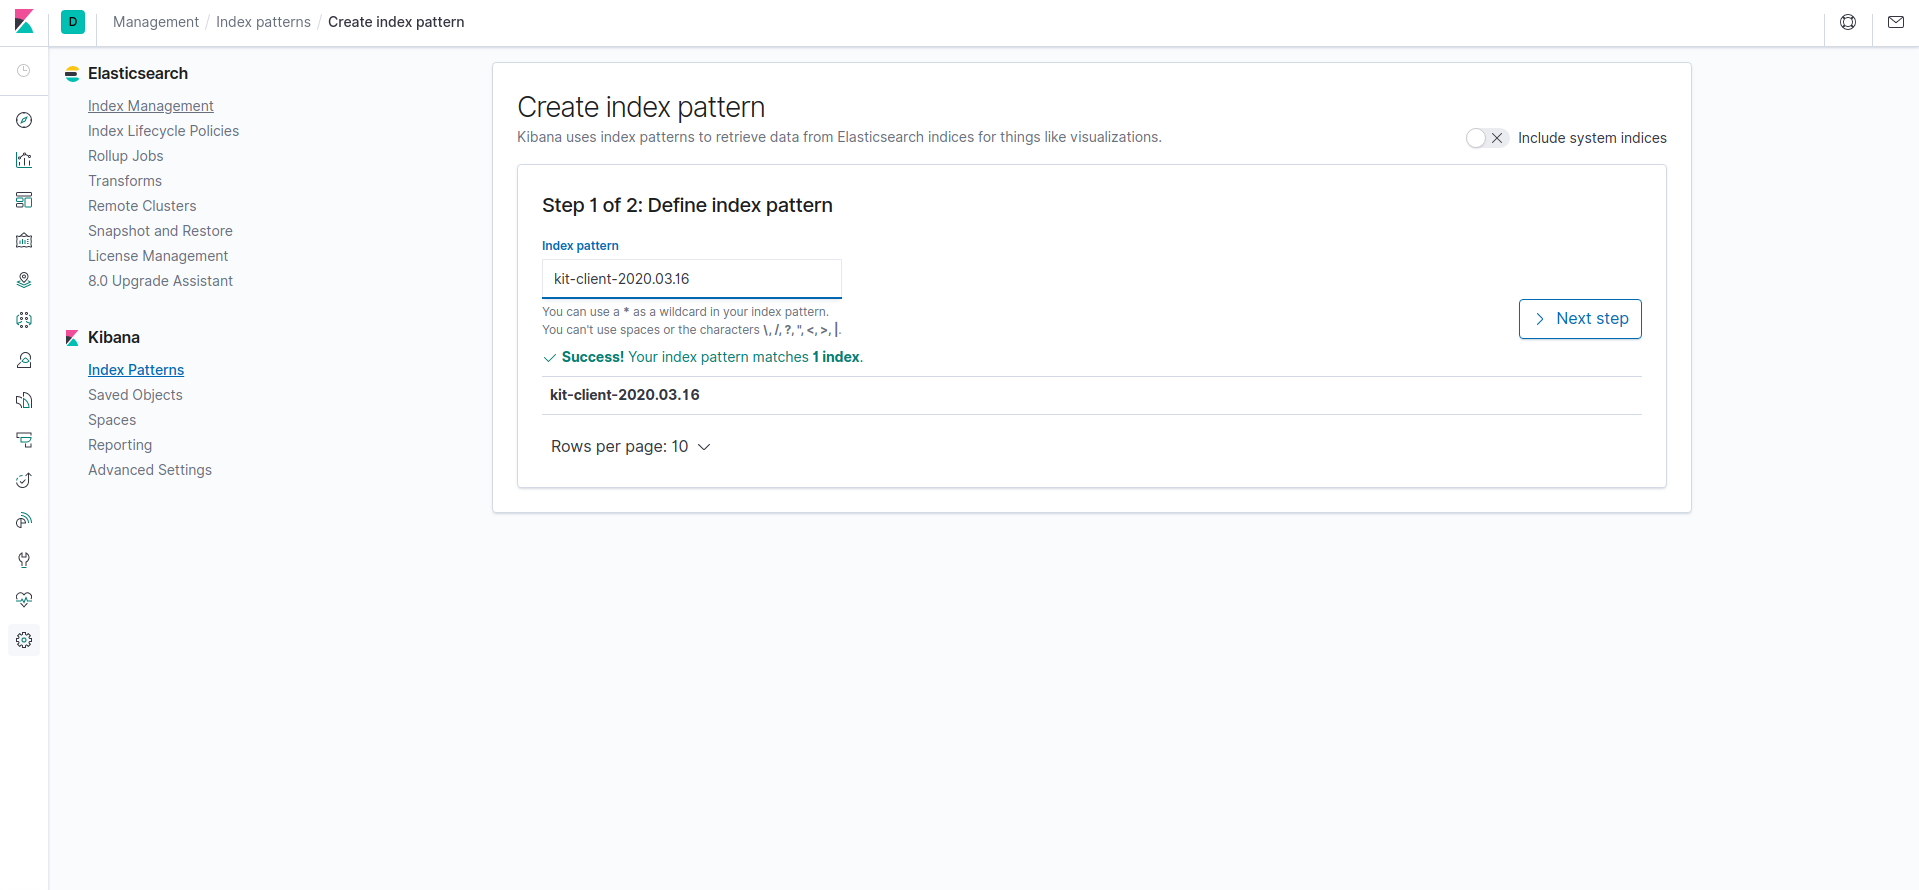
建立视图
-
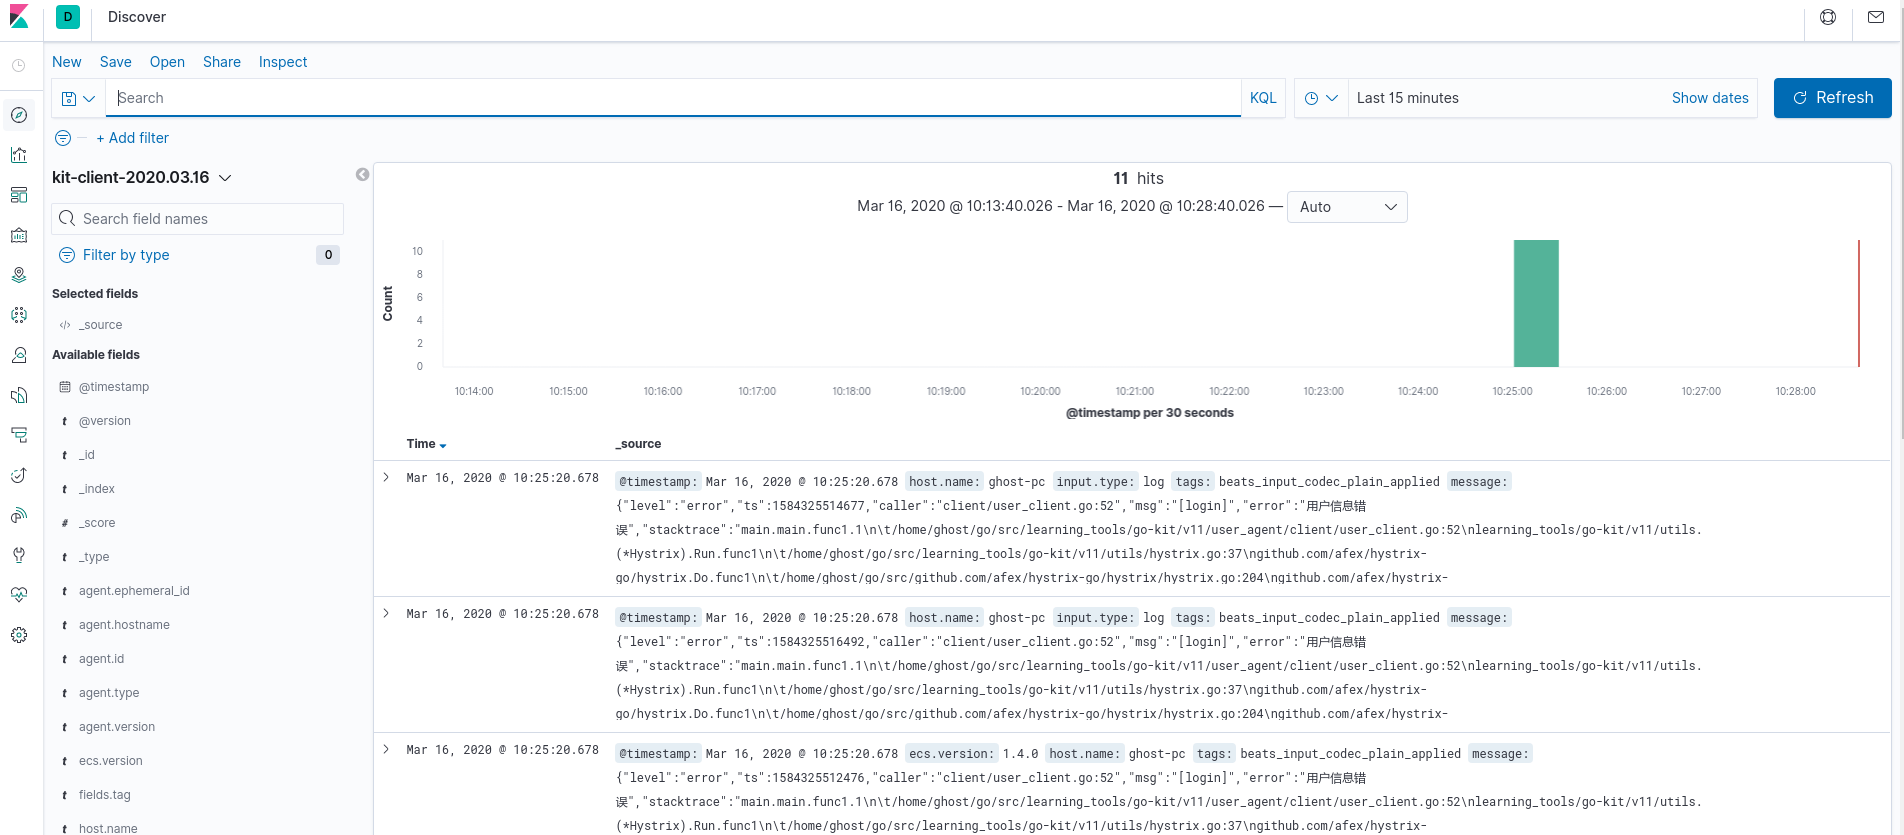
查看 kit-client 日志
-
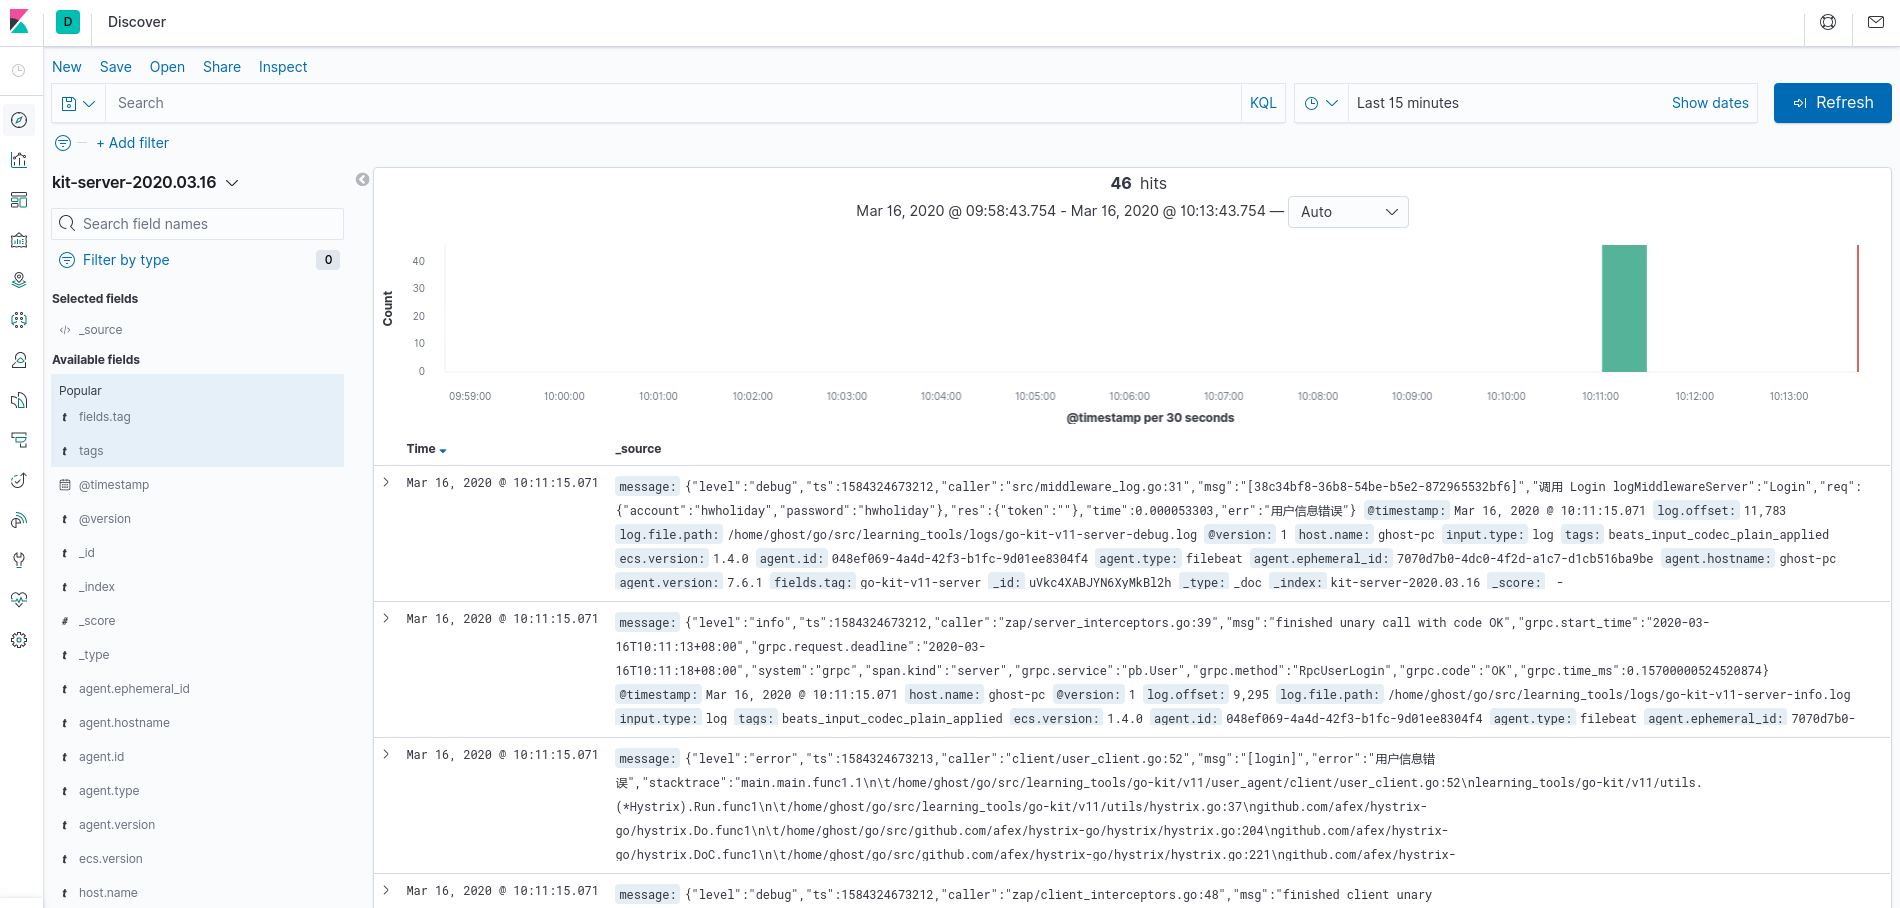
查看 kit-server 日志
结语
- 加入日志分析管理 (ELK + Filebeat),我们可以更好的监控日志,清洗数据等方便我们处理和定位问题
- 欢迎添加QQ一起讨论